
In this article
- Why science marketers consistently struggle to measure B2B customer engagement across long buying cycles
- How data silos and fragmented tech stacks block a unified view of customer behaviour
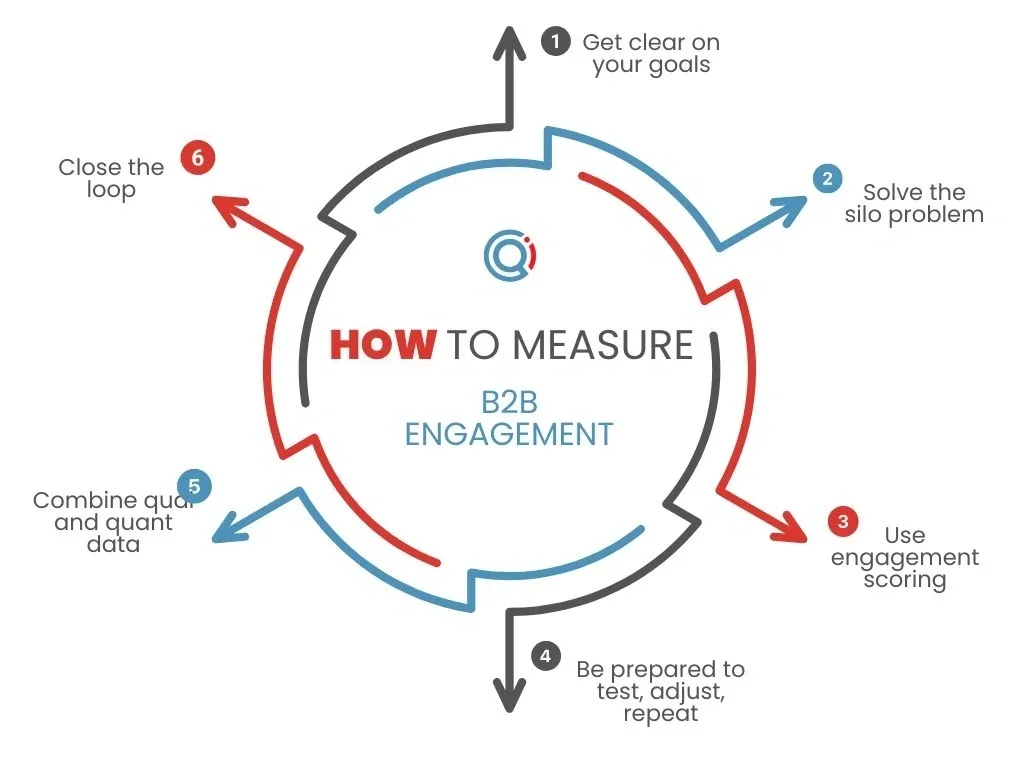
- How to define engagement goals at every funnel stage
- How to build and use an engagement scoring system to prioritise follow-ups
- Why closing the loop between engagement metrics and revenue is the most commercially important step
- What to do when a high-value prospect goes silent
As a science marketer, how do you know if your strategy is working? Measuring B2B customer engagement is like tuning a radio in a storm – signals come from multiple directions, interference is constant, and only with careful calibration can you find the right frequency to truly connect with your audience. It is also evident that whilst case studies illustrating best practice for B2C marketers are available in ample volumes, it is much harder to get hold of data and articles that talk specifically about B2B marketing challenges and innovations. It is even rarer to see discussion of the marketing nuances needed for science-led companies. This guide unpacks these challenges and offers thoughts around solutions tailored to the day-to-day reality in which science marketers operate.
Why do science marketers struggle to measure B2B customer engagement?
How do multiple channels and uneven intent signals complicate engagement measurement?
B2B relationships differ from consumer engagement in their key metrics. While consumer engagement focuses on immediate, high-volume interactions like social shares, cart abandonment, and repeat purchases – often driven by emotional connections and quick decision-making – B2B relationships rely on more nuanced interactions. These include webinar attendance, content downloads, demo requests and technical consultations. Measuring these interactions is tricky because they don’t exist in isolation; they’re often part of a protracted buying cycle, layering on top of one another in no particular order. In other words, interactions are not linear, they are spread out over months and sometimes years. Data captured by your business on any one customer might reside in various records from Account-based to Individual-based or both. On top of this, when you consider the various channels you’ve probably used to reach your B2B customers, you’re usually looking at analysing behaviour signals from multiple sources. In addition, not all sources and behaviours bring through leads with the same level of intent to buy.
How do long sales cycles create measurement blind spots in Life Science marketing?

Science-led companies often operate in industries with extensive sales cycles, sometimes stretching years. Without clear markers and data-capture hygiene, it’s easy for engagement efforts to vanish into the void. Marketers find themselves wondering: are prospects disengaged, or are they still evaluating? Salespeople grapple with uncertainty, questioning whether to persist with follow-ups or to shift focus elsewhere. Notably, 43% of B2B sales leaders reported an increase in sales cycle length over the past 12 months, impacting both sales strategies and marketing processes. [1] There may be various reasons for this. Perhaps it’s because your solution is so complex to adopt that your buyers will need a lot of time and several internal discussions to decide if they are willing to invest into the initially painful learning curve. It could be that not all of the prospects you’re engaging with have the necessary technical knowledge to judge your solution as ‘best in class’. It could be that your solution is very similar to a competitor’s and so it will come down to your potential buyers having to compare and contrast the solutions on a very granular level before making a final decision.
The long decision-making path often leads to misaligned efforts by sales and marketing teams, wasted resources, and missed revenue opportunities. Understanding that the average B2B sales cycles are commonly cited as lasting anything upwards of 9 months underscores the importance of strategic alignment between sales and marketing to navigate these prolonged timelines effectively. More than that, there is a need for a varied content stack to service months and years’ worth of touchpoints with anywhere between 10 or more different decision-makers for one sale [2], all of whom might well have different priorities.
How does siloed data block effective B2B engagement tracking?
Data fragmentation is a classic villain. When your CRM doesn’t talk to your email marketing platform, and neither communicates with your analytics platform, nor your ecommerce platform or your CMS, tracking engagement starts to feel like a mission impossible. Tech stack messiness like this hampers the flow of information and insights across an organization, making it difficult to put together and execute coordinated data-driven marketing strategies.
Consequently, marketers struggle to obtain a comprehensive understanding of each individual customer and the behaviours and motivations that led to a closed sale.
This lack of integration is more common than you might think and often stands in the way of crafting personalized customer experiences, wastes resources, and loses your business revenue. Fixing data fragmentation is therefore key to using marketing analytics effectively, improving engagement, and driving growth. You’re lucky if your task is not fixing but rather building a tech stack that works for you from the get go.
For big companies, focusing on integrating their marketing platforms will be a game-changer. Leading companies like Corteva, GE Healthcare, Siemens, Abbott and so on are 1.5 times more likely to use integrated systems, enabling seamless data flow [3], consistent messaging, and smarter marketing strategies. By adopting this integrated approach to marketing, you’ll improve personalization, optimize resource allocation, and gain clearer insights into revenue-generating activities, putting your business among the top 5% of companies that effectively deploy tactics that will drive revenue.
What happens when science marketers don’t measure engagement properly?
What should you do when a high-value B2B prospect stops engaging?
Imagine this: You’ve spent months nurturing a lead with whitepapers, webinars, and personalized emails. Suddenly, they just stop engaging. Without proper metrics in place, you’re left guessing whether they’ve lost interest, bought from a competitor, left their job, need more proof, or are simply still tied up in internal decision-making. Wasted effort, wasted budget. What happens now? It might be useful to run through a quick evaluation exercise on your cold/unresponsive leads:
1) Is timing an issue for them? Priorities and schedules may well have changed, so they need a little more time.
2) If they are a high value potential lead, perhaps they need high level of personalized outreach.
3) Maybe there’s a clear offer you can send to re-engage them.
4) Review the channels through which they were contacted, perhaps they prefer a phone call, rather than email outreach.
5) Ask for feedback in a non intrusive way, there may be some big learnings hiding in responses to this small action.
Ultimately, when a prospect goes silent, you have to re-engage them by considering if it makes sense to restart the content cycle or nurture them in a more bespoke way depending upon the results of your evaluation exercise.
How does poor engagement data lead to wasted content investment?
Without engagement data (particularly information on what content is being accessed where and by whom), you could end up overproducing irrelevant or ineffective content, hoping something will resonate with your ideal customers (ICPs). This not only drains resources but also risks alienating your audience with noise instead of value.
Why can’t science marketers prove marketing ROI without engagement metrics?
Senior leadership demands to see the return on your marketing investment. Without transparent engagement metrics that are linked to the commercial team’s objectives, you’re left stammering vague justifications, jeopardizing future marketing budget allocation.

How do you build a smarter B2B engagement measurement system in Life Sciences?
How do you define engagement goals at each stage of the Life Sciences funnel?
Before measuring engagement, define what success looks like at every stage of the funnel. For science marketers, this might mean:
- Top of the funnel: Webinar registrations, blog visits, video views, social shares.
- Middle of the funnel: Whitepaper and ebook downloads, case study views.
- Bottom of the funnel: Demo requests, email replies, meetings scheduled.
Establish your own KPIs that align with these stages to ensure clarity, and remember that the commercial team’s KPIs are focused on turning SQLs (Sales Qualified Leads) into opportunities and then closing them. This means it’s important to look at your previous wins within the CRM (Customer Relationship Management platform) to understand better the profile of ‘Closed/Won’ records. How did the lead first enter the funnel – was it a demo request or a LinkedIn ebook download? What was the source of that opportunity? What did they do next? Did they request pricing or a demo, or did they receive several follow-ups via your sales team? We won’t go into all the questions you can possibly ask at this stage, but getting clear on how and which marketing tactics have brought in the best opportunities will help you replicate more of that success.
How do you fix data silos in a Life Science marketing tech stack?
Every company we have ever worked with has had a data silo issue. Invest in tools that integrate seamlessly, like CRMs with built-in marketing analytics or platforms like HubSpot, Marketo, or Salesforce. If you have inherited a messy tech stack, do everything you can to achieve integration, which will eliminate the guesswork and give you a unified view of customer behaviour.
How does engagement scoring work for Life Science B2B leads?
https://qincade.com/blog/a-step-by-step-guide-to-building-an-omnichannel-lead-strategy/Engagement scoring assigns weighted values to specific actions (an illustrative example might be: attending a webinar is worth 10 points, downloading a whitepaper 20 points). This system can help provide an at-a-glance understanding of how engaged each lead is. Use these scores to prioritise follow-ups and graduating leads from one stage of readiness to buy on to the next. To facilitate better insights for both teams, conduct this exercise with your sales/commercial colleagues.
For example: A biotech marketer tracks engagement for a lead who attended two webinars (+20), downloaded a technical whitepaper (+30), and requested a product demo (+50). With a score of 100, this lead clearly merits immediate attention and follow-up by someone from the commercial team. Of course if they’ve landed on your landing page, and filled out a form to request a demo, they go straight into the 100’s list and will require the swiftest of follow-ups from your commercial team.
Why should science marketers apply A/B testing to engagement tactics?
The scientific method isn’t just for the lab. Use A/B testing (running two versions of a pice of content at the same time to determine a winner) to refine your messaging, calls-to-action, content formats, frequency and channels. Track how these changes impact engagement rates over time.
For example: A chemical supplier tests two versions of a webinar invite – one highlighting a guest speaker’s credentials, the other focusing on the session’s practical takeaways. The latter draws 40% more registrations. Another example, might be testing whether your US-based prospects prefer text only emails to HTML to find a much higher open rate for short text-only messages. Experiment and record your findings, so that you only invest in tactics that have the highest rates of success.
How do qualitative and quantitative data combine for better engagement insight?
Numbers don’t tell the whole story. Combine quantitative metrics with qualitative feedback, such as post-webinar surveys or interviews. This approach helps you understand the why behind the what.
For example: A lab equipment manufacturer notices a sharp drop-off in webinar attendees at the halfway point through the online event. Feedback reveals that the session was too technical for early-stage leads, prompting a shift to more top-level coverage of a topic or perhaps the need to do two separate types of webinar – one that is introductory and one that is more of a technical deep-dive.
How do you connect B2B engagement metrics to closed revenue in Life Sciences?
Engagement metrics are great, but tying them to revenue is what really matters to the C-Suite. Leverage revenue analytics within your CRM to identify which specific touchpoints and channels contribute to Closed-Won deals, and conversely, which ones don’t (and why). For example, if a customer’s journey began with a whitepaper download, escalated with a product webinar, and culminated in a sales call, credit these engagements accordingly.
Measuring B2B customer engagement isn’t about tracking clicks and opens; it’s about understanding the customer’s journey and their behaviours in as much detail as your data permits.
For science marketers, this means looking at the entire funnel and figuring out how your biggest successes came about; then doing more of it. Of course, in the process of performing the CRM analysis, you’re likely to uncover failings (not just successes) so fixing those will naturally lift your engagement rates too.
If you’re struggling to see which marketing activities are actually influencing pipeline, Qincade’s lead leakage audit identifies exactly where engagement is breaking down and what to fix first. → Book a free lead leakage audit
Key takeaways
- Science marketers struggle to measure engagement because interactions are non-linear, spread across multiple channels, and occur over buying cycles that can last years.
- Data silos, byut this we mean CRM, email platform, analytics and CMS not talking to each other. These are the single biggest structural barrier to a unified view of customer behaviour.
- Engagement goals must be defined by funnel stage before any measurement framework is built; a webinar registration and a demo request signal very different levels of commercial intent.
- Engagement scoring aka. assigning weighted values to specific interactions. This gives both marketing and sales a shared, objective language for lead readiness.
- When a prospect goes silent, run a structured re-evaluation before abandoning them: check timing, channel preference, offer relevance, and whether bespoke outreach is warranted.
- Closing the loop between engagement data and closed revenue is what converts marketing analytics from a reporting exercise into a commercial decision-making tool.
References
- 1. UpLead (2026). 150 B2B Sales Statistics to Remember in 2026. UpLead. [https://www.uplead.com/b2b-sales-statistics/] (Accessed on 04/12/2024)
- Forrester (2026). The State of Business Buying, 2026. Forrester Research. [https://investor.forrester.com/news-releases/news-release-details/forresters-2026-buyer-insights-genai-upending-b2b-buying-leaders/]
- Google/Millward Brown Digital (2014). The Digital Evolution in B2B Marketing. Think With Google. [https://www.thinkwithgoogle.com/consumer-insights/consumer-trends/the-digital-evolution-in-b2b-marketing/] (Accessed on 04/12/2024)